Table of Contents
Keeping track of your sales and profits is essential for running a sustainable affiliate marketing program, or any business. However, if you want to avoid unpleasant surprises, you'll need to understand how to read and understand a monthly sales report.
With the use of a monthly sales report, you can get a clearer picture of where your business currently stands, as well as make plans for the future. In short, a sales report will improve your business and the way you run it.
In this post, we’ll introduce you to the need for a monthly sales report. We’ll then show you a three-step process for creating your own reports, and how Easy Affiliate can help. Let’s get started!
What a Monthly Sales Report Is (and Why You Should Use One)

Just as it sounds, a sales report tracks data for how many products have been sold. The data is compiled and analyzed every month, and offers valuable insight into your business. Sales reports are used by all manner of businesses – retail stores use them to track customer behaviors and plan for the future, for example. However, your affiliate business can benefit, too. A sales report can:
- Give you an idea of where your business’ finances stand.
- Help you to improve your business processes (including marketing and lead targeting).
- Enable you to see which methods worked in the past so you can implement them in the future.
Overall, a sales report enables you to make educated decisions for your business. With your data all in one place, you can improve your decision-making process, and as a result, see increased returns.
How to Create a Monthly Sales Report for Your Affiliate Marketing Program (In 3 Steps)
A successful sales report is one that meets your business’ specific needs. With this in mind, below is a three-step method you can follow to create your own report.
1. Choose Your Affiliate Metrics to Keep Track of Business Operations

Sales metrics – such as conversion rates and time spent on page – can be helpful when it comes to optimizing your sales process. Your metrics will tell you what percentage of your leads are converting. To ensure that your sales reports maximize their value, it’s important to choose the right affiliate metrics. Here are a few tips to help you do so:
- Understand the sales process. Understanding how your leads find you, as well as what converts them to customers, will enable you to select the best metrics for your sales report.
- Know your audience. When you understand your target audience, you can better learn how to track their behaviors and reach out to them more effectively.
The more metrics you collect and track, the better. However, the more important metrics will make themselves known as you continue to track. This enables you to narrow your focus down the line.
2. Collect Your Data Using Easy Affiliate’s Reports Feature
Sales data, including conversions and profit, is something you should collect on a regular basis. It will give you an inside look at your sales process, as well as a starting point for improvement. Fortunately, Easy Affiliate’s Reports feature makes data collection easy.
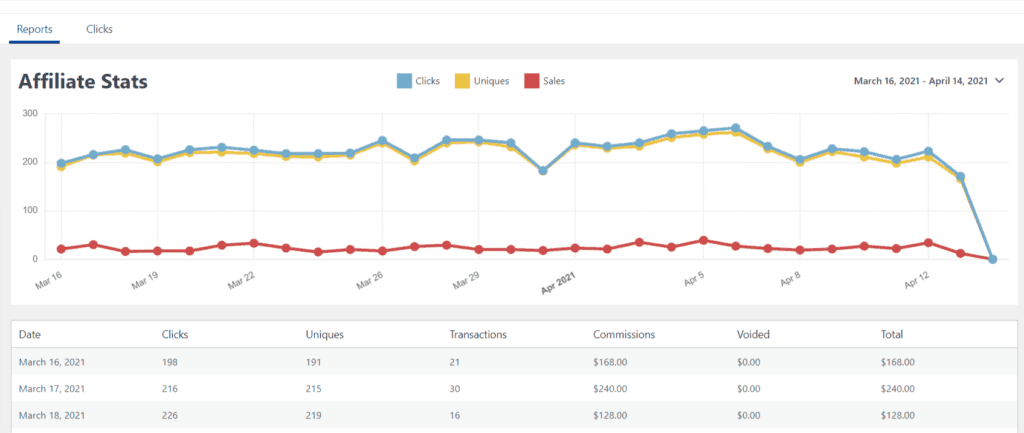
The Reports feature offers a way to track link clicks, as well as see which clicks translated to sales – giving you an overall view of your affiliate sales. To retrieve reports, go to Easy Affiliate > Reports from the WordPress dashboard:

The general Reports page will give you the basic lay down on Affiliate Stats, including Clicks, Uniques, Sale Transactions, and Commissions. However, you can always investigate each element of the general report more thoroughly with the other options available.
At the bottom of your Reports page, you can export your Reports table into a CSV file for personal record keeping.
3. Analyze Your Data and Optimize Your Findings
The data you collect using Easy Affiliate's reports can be helpful only if you know how to analyze it. Analyzing your data gives you an overall view of your sales, helping you see where your profits are coming from and where you can improve. Additionally, it offers a historical view of your business’ profits. To analyze your data:
- Understand the terms. These include ‘clicks' (number of link clicks), ‘uniques' (number of link clicks from individual users), and ‘transactions' (number of users who converted).
- Make your calculations. With the data available, you can now calculate your conversion rates and other metrics (such as product profitability and affiliate performance).
At this point, you can enter your data into your sales report template by either creating your own or finding free ones online. From here, compare it to previous months’ data, and use it to better understand how your target audience is responding to your and your affiliate’s sales tactics.
Conclusion
It’s not enough to make sales in your affiliate business. You also must know where these sales are coming from, and whether you’re making a profit. Fortunately, a monthly sales report can help you to do that and much more.
In this post, we’ve discussed the importance of a monthly sales report for your affiliate business. We’ve also outlined the three-step process for creating your own report. To recap:
- Choose your affiliate metrics to keep an eye on business operations.
- Collect your data using Easy Affiliate’s Reports feature.
- Analyze your data and optimize your findings.
Do you have any questions about creating your own monthly sales report, or how Easy Affiliate can help? Let us know in the comments section below!
If you liked this post, be sure to follow us on Twitter, Facebook, and LinkedIn! And don't forget to subscribe in the box below.


Leave a Reply